Reporting / Cloud / Analytics
Note
MAGIQ provides a standard connector for MAGIQ Documents. MAGIQ has only included our standard custom property sets for example Correspondent Information, Document Addtional Metadata, Users additional metadata etc.
If you have custom property sets or fields within existing custom property sets that need to be added, please contact your Account Manager.
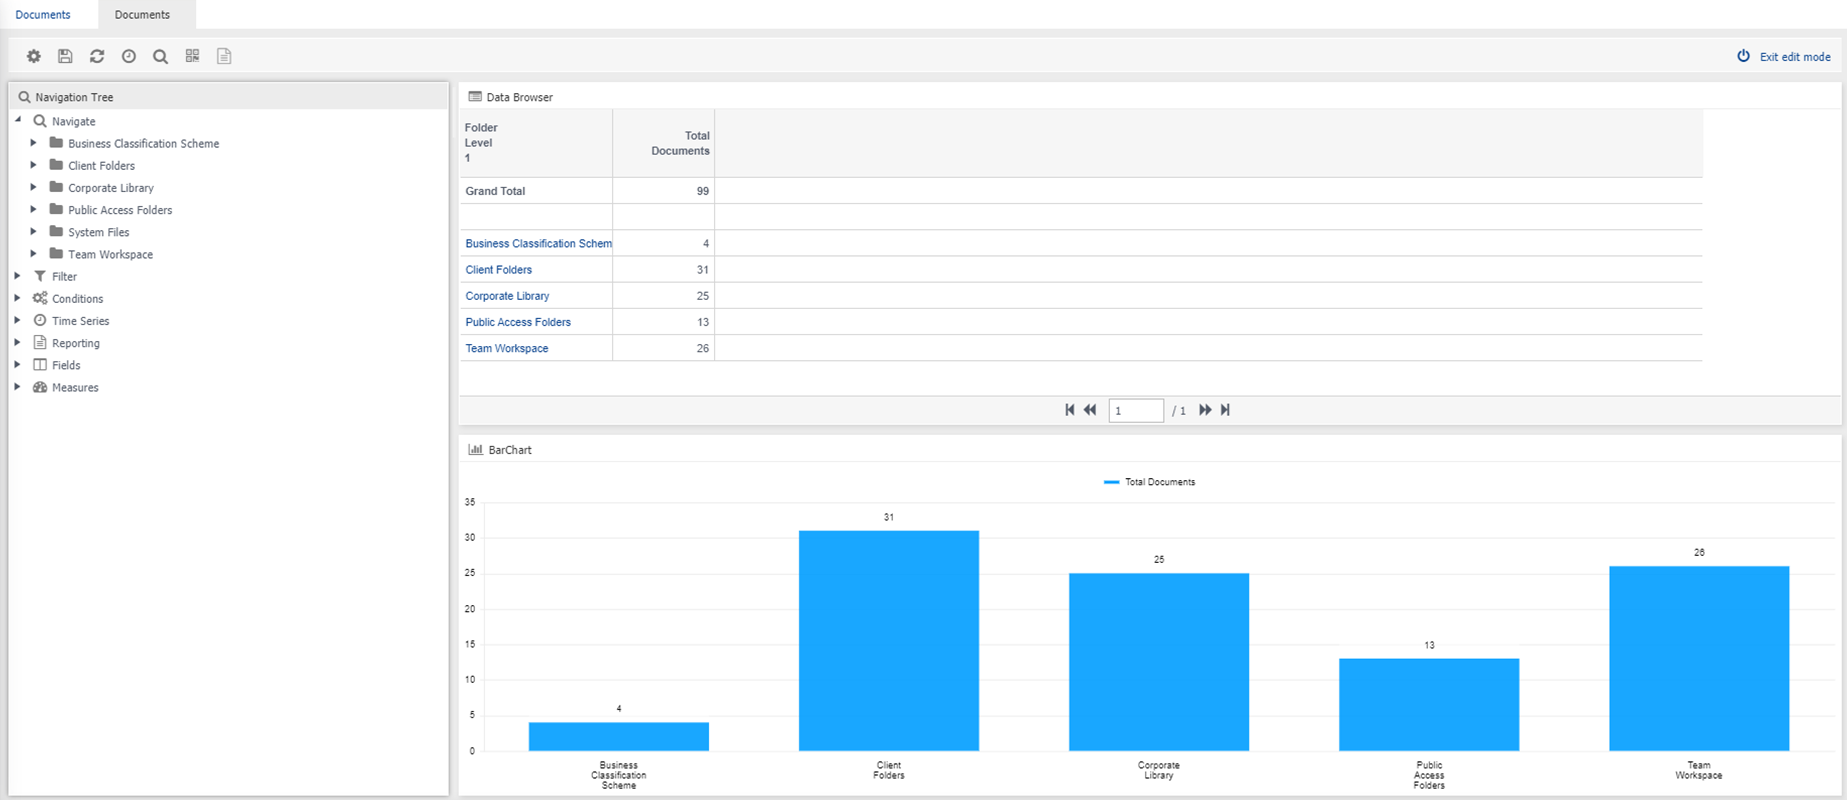
An example start-up screen showing the windows of 'Navigation Tree', 'Data Browser' and 'Chart' that build up the multi-aspect view of your data.
Connector buttons
 Settings - Determine how the widget layout will be presented, as well as other tick box options e.g. showing borders and shadows around the widgets, or to load default screen.
There is also the delete tab option. Selecting this will delete the drop-down option from the Analytics drop down menu.
Settings - Determine how the widget layout will be presented, as well as other tick box options e.g. showing borders and shadows around the widgets, or to load default screen.
There is also the delete tab option. Selecting this will delete the drop-down option from the Analytics drop down menu.
 Save As - keep all your changes and alterations to the widgets you have added to the Analytics.
If saving a new report, a prompt displays to save your settings such as Navigation Tree,
Save As - keep all your changes and alterations to the widgets you have added to the Analytics.
If saving a new report, a prompt displays to save your settings such as Navigation Tree,
 Refresh - Display the settings you had when you first logged into the system or if you saved your settings since logging into the system.
The data will be loaded based upon your last saved settings.
If you find that you’ve made too many changes and you wish to start back when you first logged into the system you can click on the Refresh icon and the data will be loaded up based on your last saved settings
Refresh - Display the settings you had when you first logged into the system or if you saved your settings since logging into the system.
The data will be loaded based upon your last saved settings.
If you find that you’ve made too many changes and you wish to start back when you first logged into the system you can click on the Refresh icon and the data will be loaded up based on your last saved settings
 Time Series - Not applicable for documents reporting.
 Zoom to - Displays a list of available layers in your data which allows you to view your data from multiple aspects.
You can move or zoom to any layer, from any layer, in your data.
NB: A right mouse click in the Data Browser window displays the options available. Move the mouse across the Zoom To option to
For example, you may be viewing your organisation from a library aspect. Zooming to the Owner Name layer will display the total number of documents registered by owner/user.
 Manage Widgets - Widgets are the three windows displayed of Navigation Tree, Data Browser and Chart.
New widgets can be added, or existing widgets can be deleted or renamed.
Renaming the Data Browser will help substantiate what is being reported on.
 Report Editor - Change the layout of the report when exported such as Title, logo, borders, different font for different levels etc