Reporting / Cloud / Analytics / Databrowser
The Data Browser window can be used to navigate through the layers of the database, allowing you to see your data from multiple aspects. Further double clicks on selected layers will move you further down into the layers of your data.
Moving up the layers of your data can be achieved by double clicking Grand Total to move you up in your data one layer at a time.
Sorting columns is achieved by double clicking the column heading.
Buttons
 Configure - Configuration settings to determine whether Navigate, Filters, Conditions, etc are visible and or expandable.
 Find - Search for relevant filters, conditions etc.
 Zoom to - "jump to" an area of data for viewing.
 Time Series - Not applicable for documents reporting.
 Refresh - Refresh the screen.
Right click menu options
Right clicking in the data browser window displays the menu options of:
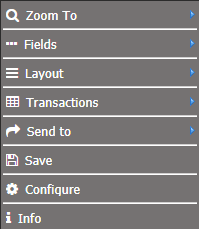
Zoom To
Allows you to view your data from multiple aspects. For example, you may be viewing your organisation from a document perspective. Zooming to the Owner layer will display all the owners with documents.
Fields
Allows you to add or remove fields/columns to your data browser. Refer to the next section for further information
Layout
Data displayed in the Data Browser window is displayed as a single dimension. By choosing layers you can introduce any other layer in the data.
Set Outer Layer To
The outer layer is best used in conjunction with the Zoom To function. Once you have set an outer layer, zoom to the layer that you want to analyse to see the breakdown.
The outer layer is used for fixing in place a selected layer in the Data Browser window. Once set, you can zoom to any layer that you want to look at in more detail whilst keeping the information grouped by the outer layer.
The advantage of using Set Outer Layer allows you to double-click on a layer in the data browser and zoom down layers or also move back up layers. You can’t do this with a multi-layer report.
Set Multi Layer To
Note
When selecting layers, you must select them in the order you want them to be displayed. If you select the wrong order you may have to start again.
Allows more than two layers to be defined in the Data Browser. For example, Task Assignee, Task Status and task. With layers defined you are unable to zoom down layers you don't have access to.
You can also add different colours to each layer as well as bold them if you like. There is also the option to choose which layer you want it automatically expanded to.
Refer to How to Generate a report of an example of how a Multi Layer report can be configured.
Set Crosstab Layer To
The outer layer has one layer fixed, except it is across the top of the report. This creates a landscape version of reports and can be useful for grouping certain layer differences together. For example, Total number of documents created for multiple years.
Refer to How to Generate a report of an example of how a crosstab report can be configured.
Transactions
Not currently used.
Send To
Send your report to either excel report, dashboard or documents.
Excel
Exports the report to Microsoft Excel.
Excel > As Is - Generates a preview report of the data at the layer displayed in the Data Browser window. If you have too many columns in the Data Browser window you will receive a warning message indicating that not all columns may appear on the report. All user settings such as column placement, sorting, fonts, colours, alignments are applied to the report. The report header is also automatically generated and applied.
Excel > With Sub Layer - Generates a preview report summarised at the level displayed in the Data Browser window, followed by a selected sub layer (which can be any layer above or below the displayed layer).
Report
Reports are generated from within the Data Browser window.
Report > As Is and With Sub Layer – Refer to the above.
Customise
Generates a preview report with as many layers as you select, in any order of preference, with page breaks at any level you choose.
Select the layers you wish to view in your report by clicking on a layer in Available Layers and dragging it across to the Selected Layers column.
Dashboard
You have the option to attach the Data Browser window to a Dashboard.
Select the relevant Dashboard and the Data Browser window will then be available as an item in your Dashboard.
Save
Saves the configuration of your data browser window as a new default or save as data browser/widget.
Several Data Browsers can be showing at the same time in the system by saving the layout of the Data Browser and retrieving it at a later stage.
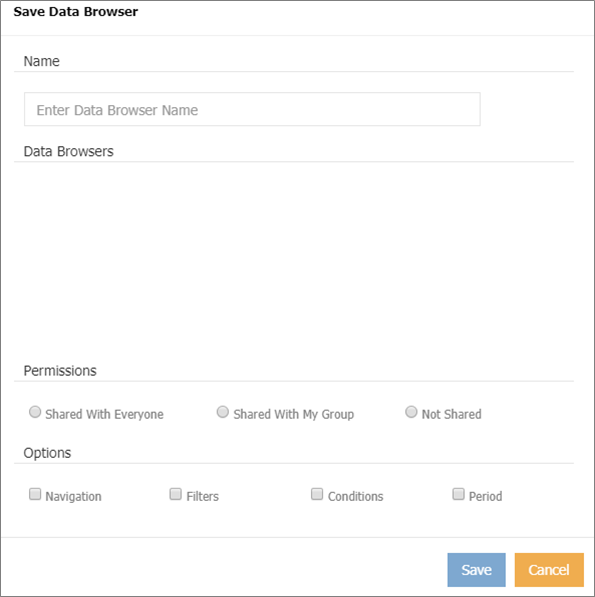
Name - Enter a name for the Data Browser.
Data Browsers - select a data browser that you want to overwrite.
Permissions
Shared with Everyone - All users can use the Data Browser setting you have saved (only the data restricted by their security access will be displayed to them).
Shared with My Group – if your System Administrator has configured Groups in the security area (e.g. Finance Group) then you can save to that group. Only the members of the Group can access the saved Data Browser.
Not Shared - the Data Browser you have saved will only be available for your use.
Options
Check the boxes to indicate what properties you wish to save:
Navigation - Tick this to save any navigation selections
Filters – tick this to save any filters you wish to save on your Data Browser.
Conditions - tick this to save any conditions you wish to save on your Data Browser.
Period – Not Applicable (this will save the time series that you are currently at when saving your screen.).
Configure
Configures the appearance of the data browser and the layout of the report should it be exported.
Info
Shows what filters and conditions have been applied.